Grafana is a popular open-source observability solution that lets you visualize metrics on graphical dashboards. Grafana has connectors for a broad selection of data sources including time series databases, search engines, and individual applications. In this article you’ll learn how to use Grafana to set up simple monitoring for a MySQL database server using the official Grafana Cloud integration.
Getting Started
Grafana’s available for self-hosting on your own hardware or as a managed SaaS platform called Grafana Cloud. We’re using Grafana Cloud in this tutorial because it supports quickstart integrations that connect to your data source and provide pre-built dashboard layouts for the most common metrics.
Sign in to your Grafana account to begin. You can create a new Grafana Cloud account for free to store up to 10,000 metrics series and 50GB of logs.
Adding the MySQL Integration
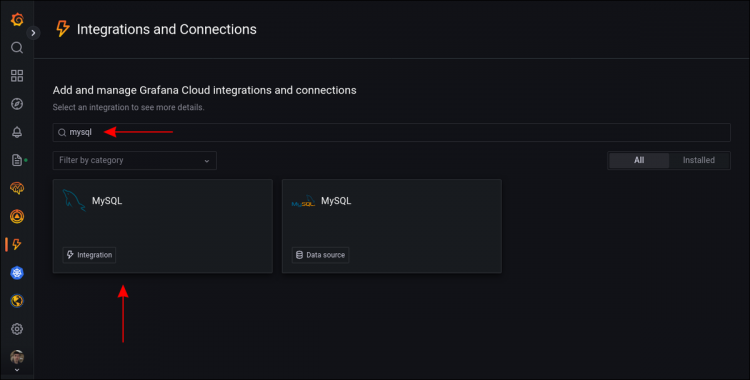
You can add the MySQL integration to your account by heading to the “Integrations and Connections” page, accessed from the lightning bolt icon in the left sidebar. Enter “mysql” into the search bar at the top of the screen.
You should see two results appear, both labelled “MySQL”. Choose the one that’s marked as an “Integration.” Integrations include a simplified configuration experience and pre-built dashboard layouts for monitoring key server statistics. The alternative option, “Data source,” requires you to manually connect to your server, extract metrics, and assemble dashboards.

The next screen will prompt you to select the operating system and processor architecture of the machine that’s hosting your MySQL server. Adjust the dropdown menu options to match your system. Press the blue “Install integration” button to view the appropriate Grafana Agent installation instructions.
Installing Grafana Agent
Grafana Agent is a utility that runs as a system service to collect metrics from your machines. It sends data up to your Grafana account where it’ll appear in your dashboards. The agent is a pared-down version of the Prometheus data collector.
Running the script shown on the MySQL integration screen will download Grafana Agent, configure it with your Grafana Cloud account, and set up MySQL monitoring. Data will be collected every 60 seconds when you’re using the default settings.

Copy the displayed script and run it on the server that’s hosting your MySQL databases. You’ll see a few lines of output as the script downloads the binary and retrieves your config file.
Check the Grafana Agent service has started successfully before you continue:
$ sudo systemctl status grafana-agent.service
● grafana-agent.service – Monitoring system and forwarder
Loaded: loaded (/lib/systemd/system/grafana-agent.service; enabled; vendor preset: enabled)
Active: active (running) since Sat 2022-08-13 17:39:03 UTC; 39s ago
Docs: https://grafana.com/docs/agent/latest/
Press the “Test integration” button in your Grafana Cloud account to check everything’s ready to use. The agent should be feeding data up to Grafana.

You can now press “View Dashboards” to start interacting with the visualizations included with the integration.
Exploring Your Dashboards
The MySQL integration comes with two dashboards: MySQL Overview and MySQL Logs. The Overview dashboard provides graphs covering every aspect of your MySQL server’s operation, including uptime, queries per second, active connections, queries, sorts, and network activity. You can utilise these metrics to interrogate MySQL performance and identify optimization opportunities.

The Logs view offers a feed of the log files written by your MySQL server instance. The integration automatically collects the logs within the /var/log/mysql directory. The dashboard includes graphs of the number of log lines that have been written, broken down by severity level and error code.

The dashboards can be customized by clicking the settings icon in the top-right and pressing the “Make editable” button. This will let you change the dashboard’s configuration using the other controls on the settings screen. You’ll also be add to add and edit the graphical panels shown on the dashboard.
Grafana Agent MySQL Server Authentication
One challenge you might encounter concerns the MySQL user account that Grafana Agent uses to access your database. The agent is configured to use root by default. This won’t work if MySQL root login is disabled on your server, or you’ve blocked root connections to specific databases.
You can improve security and regain control by creating a dedicated MySQL user for Grafana. Run the following commands in a MySQL shell to add a user and password, then grant it privileges to access your data:
> CREATE USER ‘grafana’@’localhost’ IDENTIFIED BY ‘<your-password>’;
> GRANT ALL PRIVILEGES ON *.* TO ‘grafana’@’localhost’;
> FLUSH PRIVILEGES;
The privilege grant on *.* allows the user to access any table on your server, across all schemas. You could change the GRANT statement to restrict Grafana’s privileges or limit interactions to specific schemas and tables. However the integration works best with elevated privileges that include the MySQL system tables. This permits collection of the most comprehensive selection of metrics.
Once you’ve created your user, edit your Grafana Agent configuration file to authenticate with its credentials. You’ll find this at /etc/grafana-agent.yaml. Look for the following section:
integrations:
mysqld_exporter:
data_source_name: root@(localhost:3306)/
The data_source_name field defines the MySQL server address and user credentials. Modify it to reference your new account.
data_source_name: grafana:<your-password>@(localhost:3306)/
Restart the Grafana Agent service to apply the change.
$ sudo service grafana-agent restart
Summary
Grafana’s built-in MySQL integration provides a convenient way to monitor the performance of your database server. The included dashboard layouts aggregate your error logs and graph all commonly measured metrics, keeping you aware of resource utilization and query activity.

Regularly monitoring this data can help you spot emerging performance trends and resolve anomalies before they become a problem. Manually logging and retrieving these metrics would be a chore whereas Grafana dashboards give you everything on one screen, facilitating efficient analysis.
Source by www.howtogeek.com


