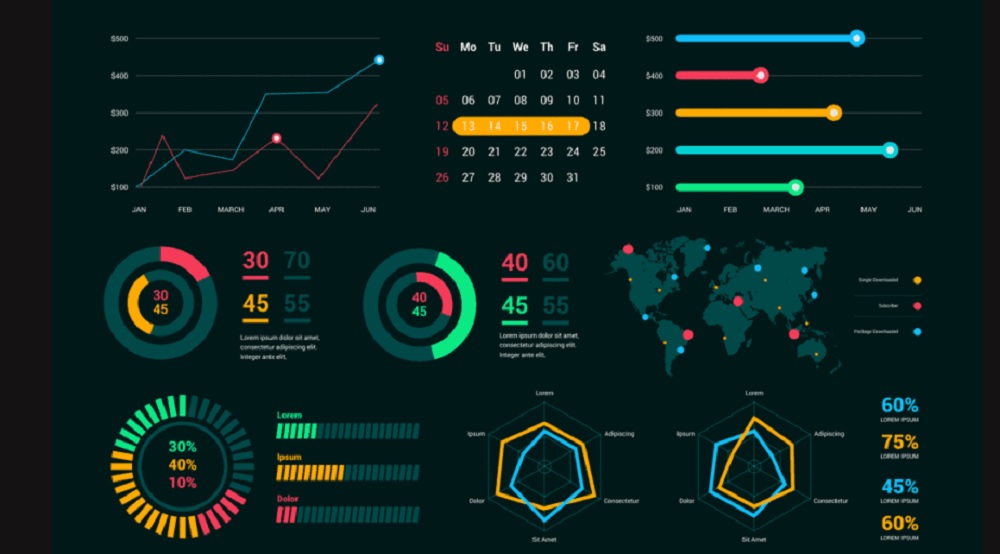
Data visualization refers to the presentation of data in a visual format such as charts, graphs, and maps. This technique allows us to showcase complex information in an easy-to-understand manner. With data visualizations, we can identify patterns and trends that might not be apparent when looking at raw data.
Data visualization aims to transform complex numbers into easily digestible visuals that can be analyzed for insights. By presenting data visually, we can spot correlations between variables, detect outliers and anomalies, and make informed decisions about the next steps to take. For example, a company might use data visualization techniques to analyze sales figures over time or compare customer satisfaction levels across different regions.

Overall, data visualization is a crucial tool for anyone who needs to analyze large sets of information quickly and efficiently. It enables us to communicate our findings in a clear and concise way so that others can understand the significance of the results.
Types of Data Visualizations
Data visualizations are compelling tools that improve the way we communicate data. With the help of charts, graphs, and other visual aids, complex information can be presented in an easy-to-understand format. There are several types of data visualizations available, each with its unique benefits and drawbacks.
One common type of data visualization is a bar chart. This type of chart uses horizontal or vertical bars to represent different categories or values in a dataset. Bar charts are useful for comparing multiple sets of data at once and identifying trends over time.
Another popular type of visualization is a line chart, which is ideal for displaying changes in data over time. Line charts can show how variables change relative to one another or how trends evolve over time.
Pie charts are another common type of visualization used to show percentages or proportions within a dataset.
Elements of an Effective Visualization
Data visualizations are an incredibly powerful tool for conveying complex information in a way that is easy to understand. But not all visualizations are created equal. There are certain elements that can make or break the effectiveness of visualization, and understanding these elements is key to creating visuals that truly communicate your message.
One essential element of effective data visualization is clarity. The purpose of a visualization is to make complex data more accessible, so if people can’t understand what they’re looking at, it defeats the whole point. To ensure clarity, it’s important to choose the right type of chart or graph for your data and to label everything clearly. You should also avoid cluttering your visualizations with unnecessary elements like excessive colors or decorations.
Another key element of effective data visualization is accuracy.
Benefits of Using Data Visualizations
Data visualizations are an excellent way to present complex information in a way that is easy to understand. They allow individuals and businesses alike to gain new insights from their data, making it easier to make informed decisions. This type of visualization is becoming increasingly popular because of the benefits it offers.
One of the significant benefits of using data visualizations is that they help people understand large amounts of information quickly. This allows businesses and individuals to identify patterns and trends that may not be immediately apparent when looking at raw data. Additionally, data visualizations can help with communication by simplifying complex concepts into easily digestible formats.
Another benefit of using data visualizations is that they make it easier for people to identify outliers and anomalies in their data. This can be crucial for businesses that need to detect any abnormalities or problems before they turn into significant issues.
Advantages of Data Visualization
Data visualization is a technique that can be used to present complex information in an easy-to-understand format. With the rise of big data, it has become more important than ever to use data visualizations to make sense of the vast amounts of information available. The advantages of data visualizations are numerous and can help organizations better understand their data and make more informed decisions.
One major advantage of data visualizations is that they make it easier for people to spot patterns and trends in large datasets. By presenting numerical information graphically, individuals are able to see patterns and trends that may not be immediately apparent from looking at raw numbers alone. This allows organizations to identify areas where they need to focus their attention or allocate resources more effectively.
Another advantage of data visualizations is that they can help simplify complex concepts by presenting them in a way that is easy for people to grasp.
Disadvantages of Data Visualization
As data has become an increasingly important part of decision-making in the modern world, data visualizations have gained traction as a popular way to present information. However, while there are certainly benefits to using data visualizations, there are also some significant disadvantages that should not be overlooked.
Firstly, one of the main downsides of data visualizations is that they can be misleading. This is particularly true when graphs or charts are used to highlight specific details and ignore others. For example, a bar graph may show a company’s profits increasing over time but fail to mention that expenses have also been rising at the same rate. In cases like these, it can be easy for readers to draw incorrect conclusions based on incomplete or biased information.
Another issue with relying too heavily on data visualizations is that they often oversimplify complex ideas.
Read Also: How Does Data Modernization Benefits Your Business
Tools for Creating Visualizations
Data visualizations provide a powerful way to communicate complex information in a simple and intuitive way, enabling businesses to make better decisions. However, creating an effective data visualization can be challenging without the right tools. Fortunately, there are many options available that can help you create compelling visuals that will engage your audience and help you tell your story.
- Tableau
- Chart.js
- Flourish
- Datawrapper
- FusionCharts
- D3.js
One of the most popular tools for creating data visualizations in Tableau. This software allows users to create interactive dashboards and charts using drag-and-drop functionality, making it easy to explore data and uncover insights. Other popular options include Microsoft Power BI, which offers similar capabilities but with a focus on integration with other Microsoft products like Excel.
For those looking for more flexibility in their visualization creation process, open-source tools like D3.js or R Shiny offer powerful customization options.
Conclusion
In conclusion, data visualizations offer immense benefits for businesses and organizations. They can help users better understand complex data sets and make more informed decisions. Data visualizations also allow managers to quickly identify trends or outliers in their data that may otherwise be overlooked. Additionally, they allow users to spot correlations between different pieces of information easier and faster than with traditional methods. Finally, they provide users with an efficient way to communicate large amounts of information clearly and effectively.


